← All projects

Case Study · Google Domains · Q3 2019 — Q2 2020

Domains Reports understand what drives traffic

Domains Reports provides the tool to understand what keywords drive the most traffic to their website and how they can optimize their online presence along with their business growth from other Google products like Search Console.

Role
UX · UI · Illustrations
Duration
Q3 2019 — Q2 2020
Team
Google Domains
Scope
Insights & reporting

"I know I should be doing this, but I am not"

CUJ

"As a SMB (small-medium business) owner, I want to monitor, gain insights, and grow my online presence."

The problem. There's a desire by SMBs to leverage analytics, but they are intimidated for the following reasons:

Project goal

Empower users to gain insights into their website's traffic originating from Google Search. This feature enables users to analyze data, understand the driving factors behind traffic, and optimize content accordingly.

My role

I led the UX and UI design for this project, collaborating extensively with cross-functional partners including Product Management, Engineering, Marketing, User Experience Research (UXR), User Experience Writing (UXW), gTech, and cross-Product Area (PA) teams like Search Console and Google Analytics.

My tasks

  1. 1Planning and scope definition
  2. 2Ideation and Research
  3. 3Documentation and Communication
  4. 4User interface and experience
  5. 5Cross-Team Collaboration
  6. 6Support implementation & Track launch metrics

From evidence to a shippable feature

A four-phase process took Reports from open questions to a validated, launched design.

1. Foundational research

8 qualitative interviews with SMBs to understand user journeys after successful setup of a website. Identified valuable attached services and pain points hindering service adoption.

2. Brainstorm session

Led a cross-functional brainstorming session to translate research findings into project objectives. Explored and defined the ideal vision for attached services, ensuring alignment across teams.
3. User studies

Conducted 8 qualitative sessions to explore Reports integration and reviewed 13 design variants across 4 concepts. Conducted terminology testing on four potential labels for the Analytics section in Domains.

4. Scope out feasibility

Prioritized Reports features and data based on concept study feedback. Collaborated with engineers, PMs, and cross-functional PAs to define project scope. Developed high-fidelity designs incorporating user insights.
Getting to know the SMB owner

Interviews with 8 SMBs to understand user journeys after successful setup of a website.

A. Primary audience

SMB owner audience

Google Domains' user base has a mix of 'Web professionals' (e.g. agencies, developers, advanced users) and 'SMBs' (e.g. very small businesses, side hustlers, etc.). Our primary audience for this integration is mainly SMBs, but we segregated them based on the usage and awareness of attached services (analytics and Ads) and focused on the SMB users who:

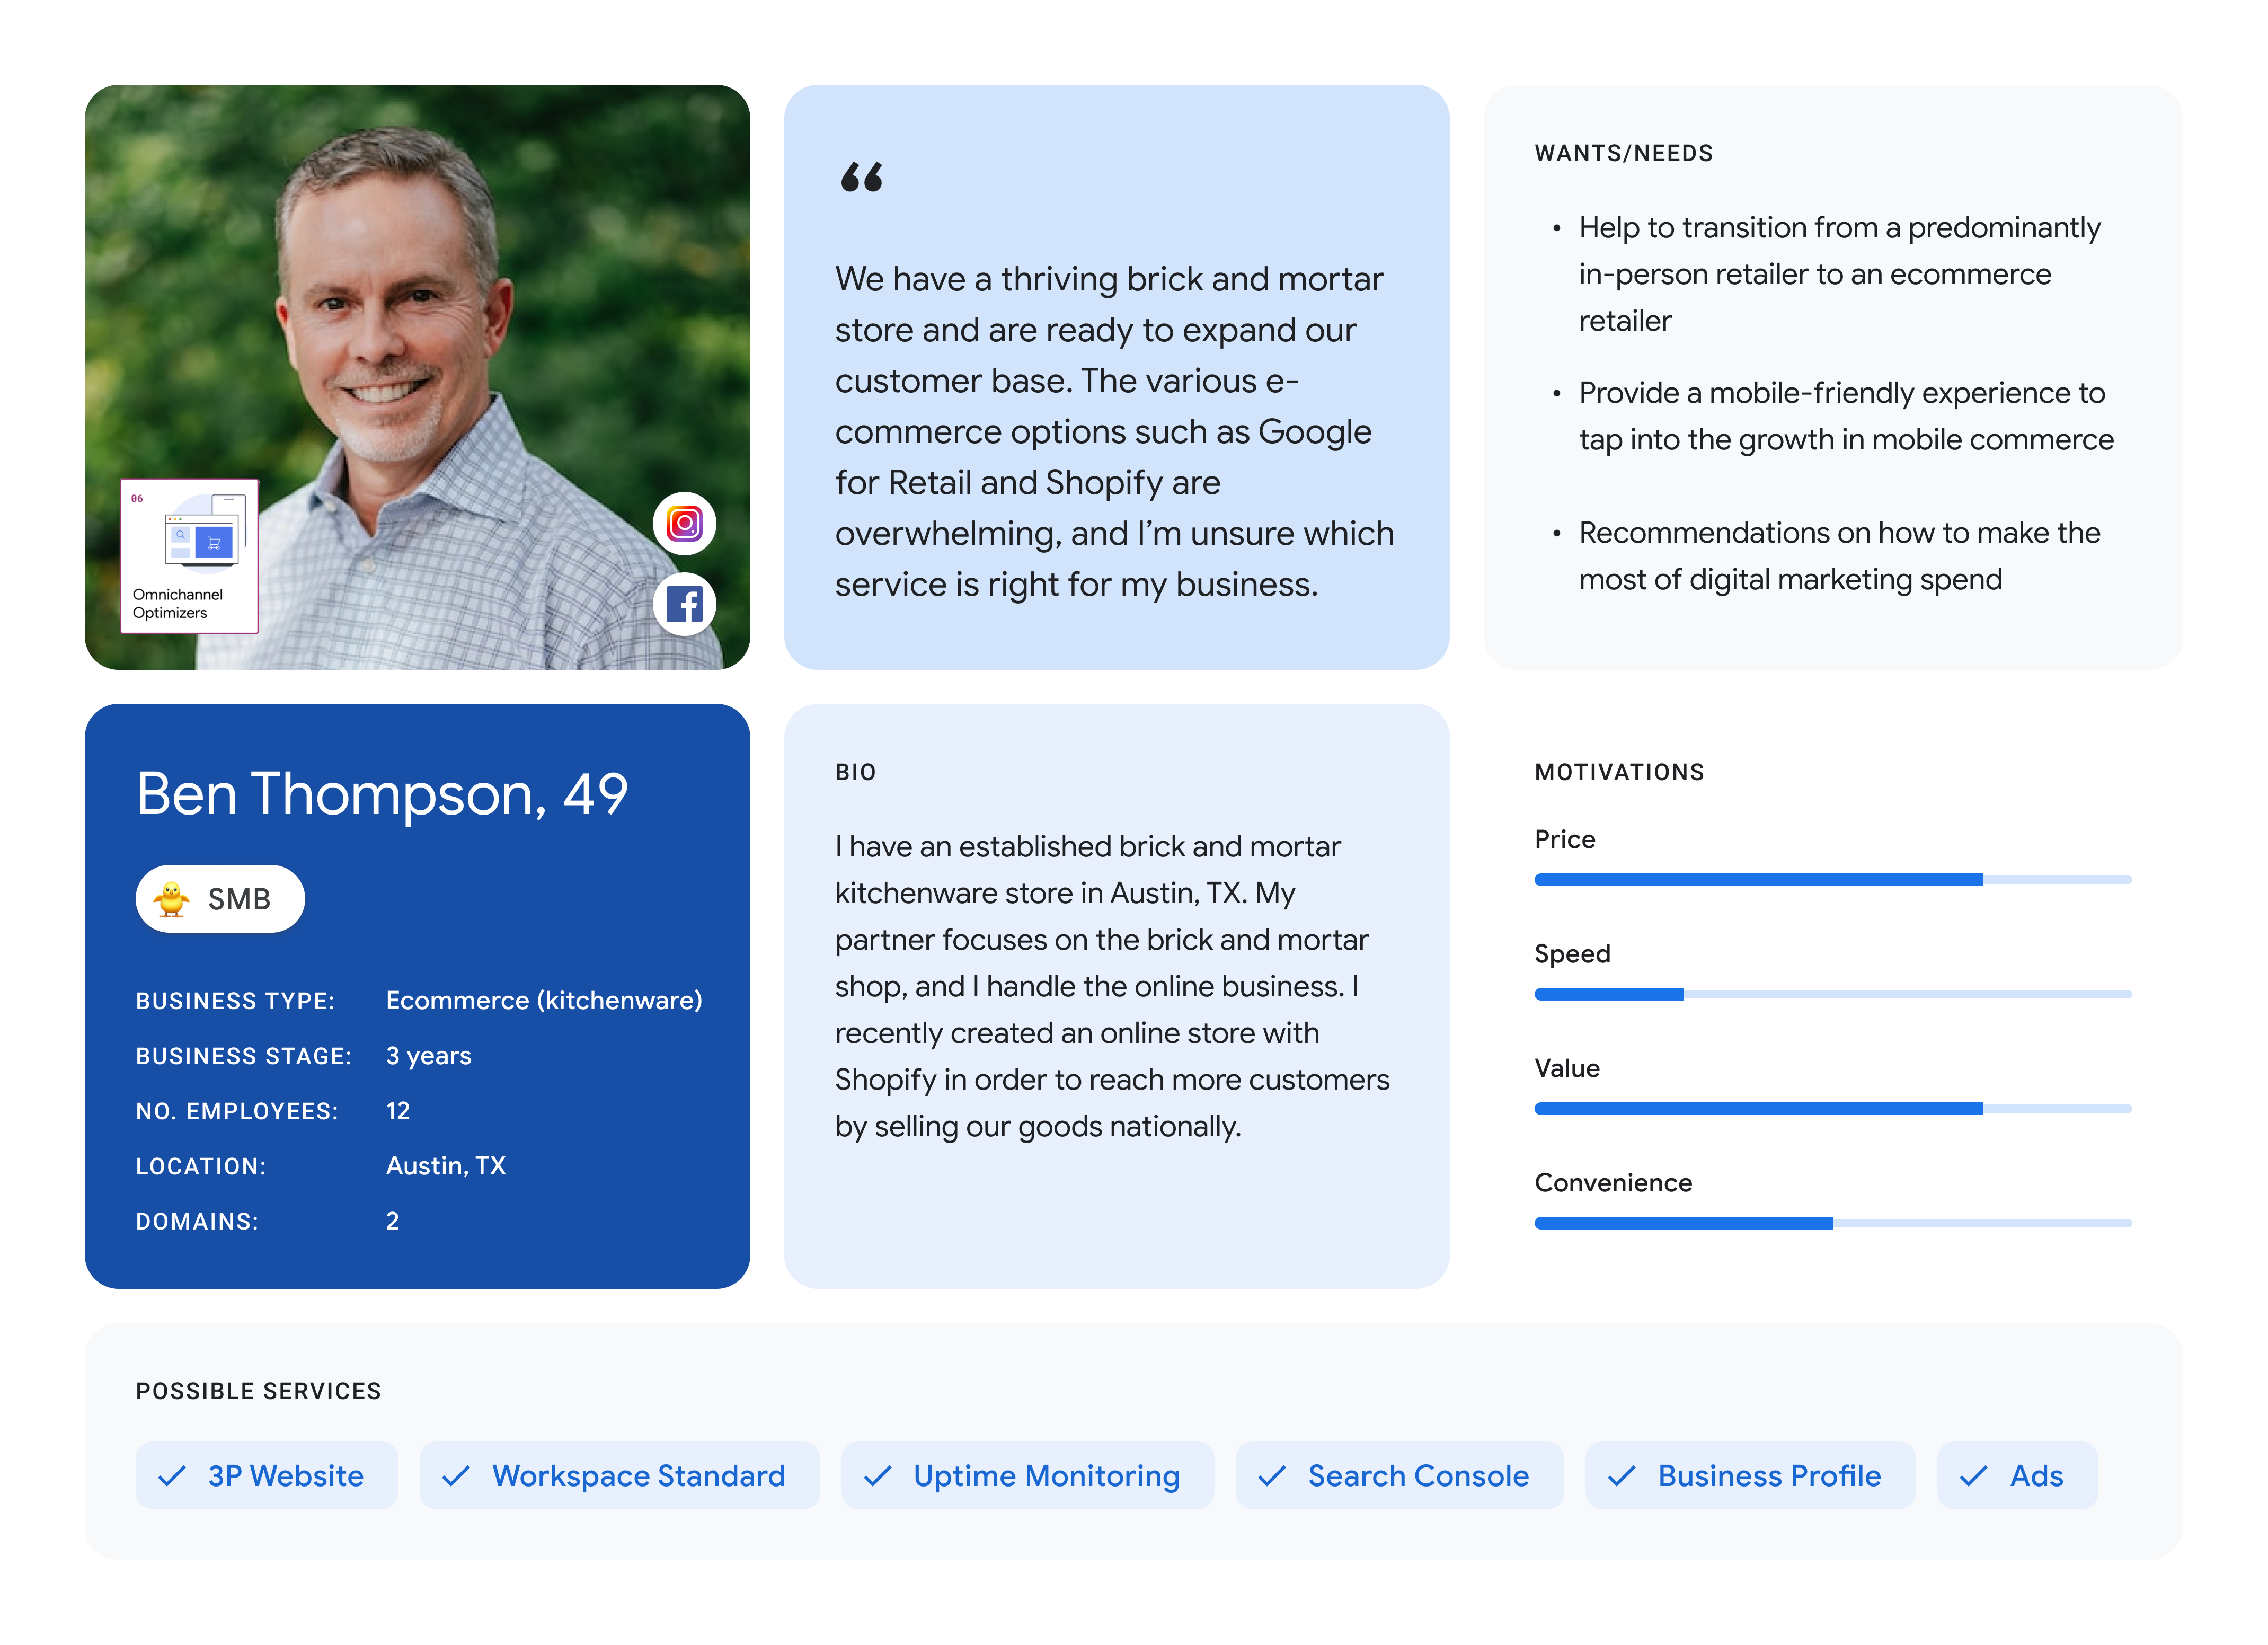
Ben Thompson persona card
Persona · Ben Thompson, the small business ownerThe SMB owner persona synthesized from foundational interviews — goals, frustrations, and the moments that matter.

B. Research insights

The high-level questions we addressed were:

Search Console as a concept is appealing

Users understood at a high level the value propositions from Search Console and found it relevant to their use cases (informing keyword content, identifying page errors).

Search Console in execution is challenging

Users had difficulty setting up Search Console if it wasn't already on their site. Once inside, they struggled with the terminology and found it hard to turn data into insights.

Help users translate analytics and AdWords into impact

SMBs in particular perceive these areas as requiring digital marketing expertise. Reduce their load by summarizing key insights and relating them back to actions they have completed.

Incorporate a push model for analytics

Users were open to a push-based model for surfacing analytic insights — valuable for providing a high-level summary and highlighting insights users might have missed.

A session with 12 cross-functional partners

I facilitated a half-day brainstorming session with 12 cross-functional team members (3 PM, 3 Eng, 1 Marketing, 1 Business Development, 4 UXers). We discussed our ideal vision for Reports, produced ideas and sketches, and explored directions in order to inform the future concept design study.

We analyzed Search Console features and how users utilize the information. Since Search Console's primary use cases and target audience differ from Domains' target audience, we brainstormed what value we could provide to our users in addition to Search Console and what features would be most useful to them. The resulting concepts prioritized:

1

Dashboard

A consolidated view of key metrics from DNS, analytics, and Search Console.

2

Solution-oriented education

Offer educational content to help users understand and utilize analytics effectively.

3

Push models

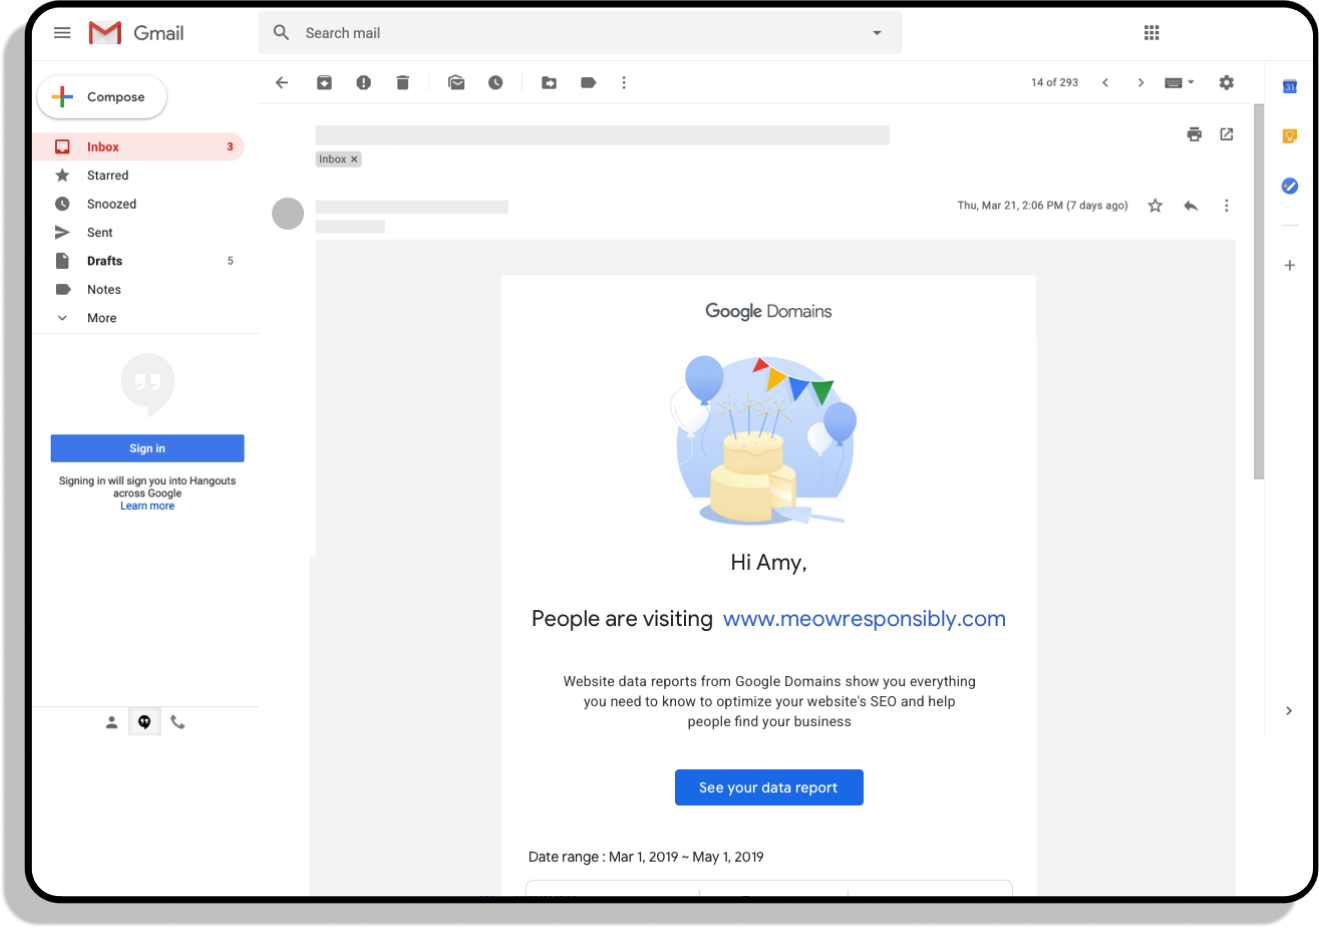
Send email notifications to alert users about new analytics features or relevant updates.

Validating concept and language

A. Concept study

Building upon our brainstorming and foundational research insights, I collaborated with UXR to conduct a concept study. We facilitated eight 60-minute one-on-one sessions to explore four distinct concepts for integrating analytics into the user experience. Our goals were to:

  • Explore various concepts for effectively introducing analytics to users.
  • Determine the level of detail users require from analytics reports.
  • Investigate potential integrations between Search Console and Google Domains.

Critical user journeys we captured in concepts

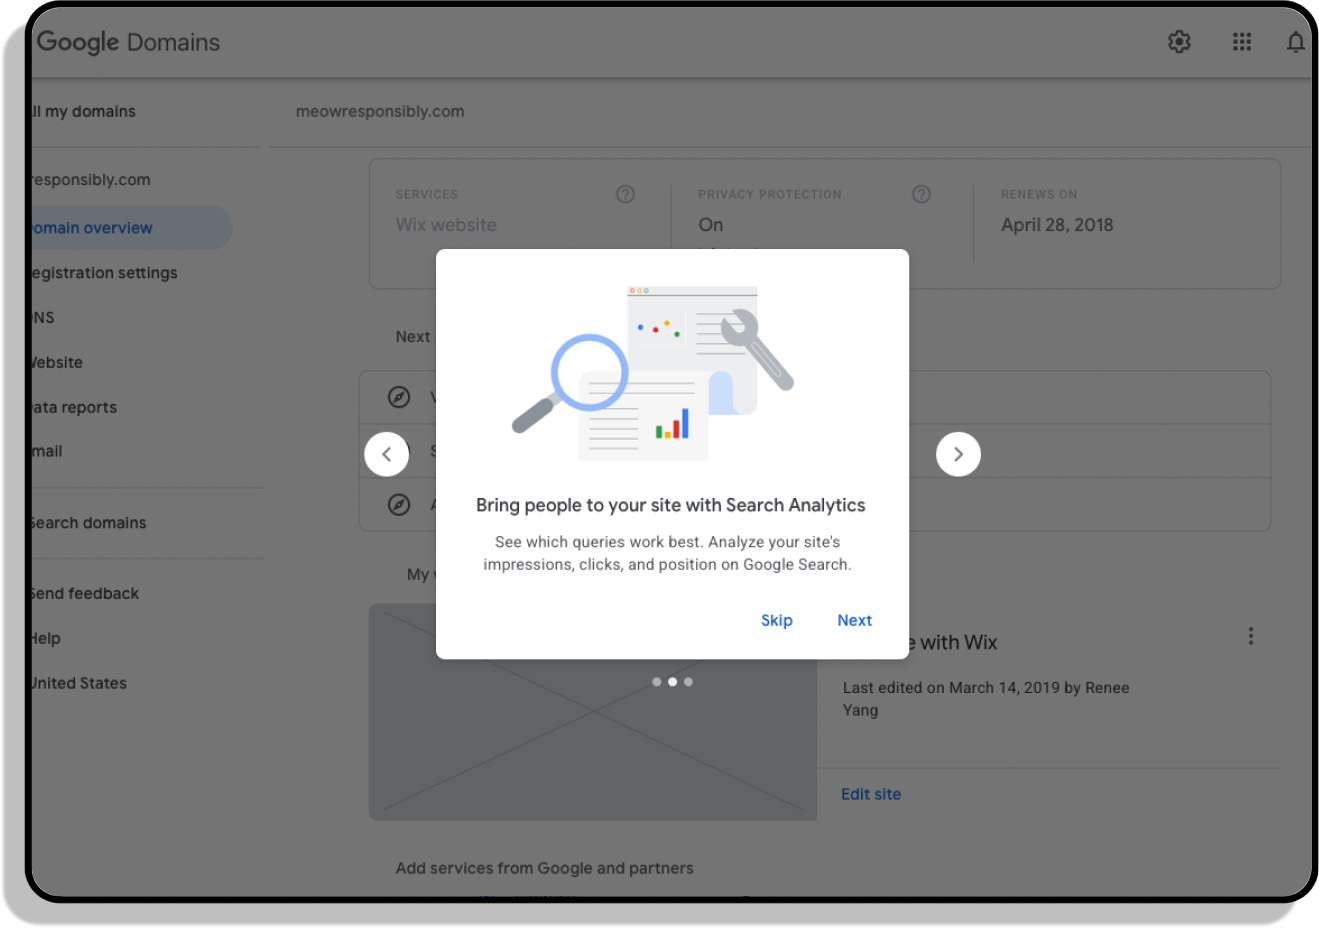
Discoverability & introduction of attached services

"As a small business owner, I want to build a website with analytics automatically provided for me so that I can leverage its insights without having to fuss around with setting it up."

Learning opportunities

"As a small business owner, I want to define how customers get to my site, what queries are being entered, and which page they visited so I can use insights for my digital marketing — reaching the right people at the right time to bring in more customers."

Understandable & actionable insights

"I want to see summarized monthly insights of how my website is doing, identification of trends, and recommendations for improvements — and learn how I can improve its discovery on Google Search."

Concepts tested

Concept: Solution-oriented education
Solution-oriented education
Concept: Analytics introductions
Analytics introductions
Concept: Search Console integrated dashboard
Search Console integrated dashboard
Concept: Email notifications
Email notifications

Main takeaways

Recommendations

B. Reporting terminology

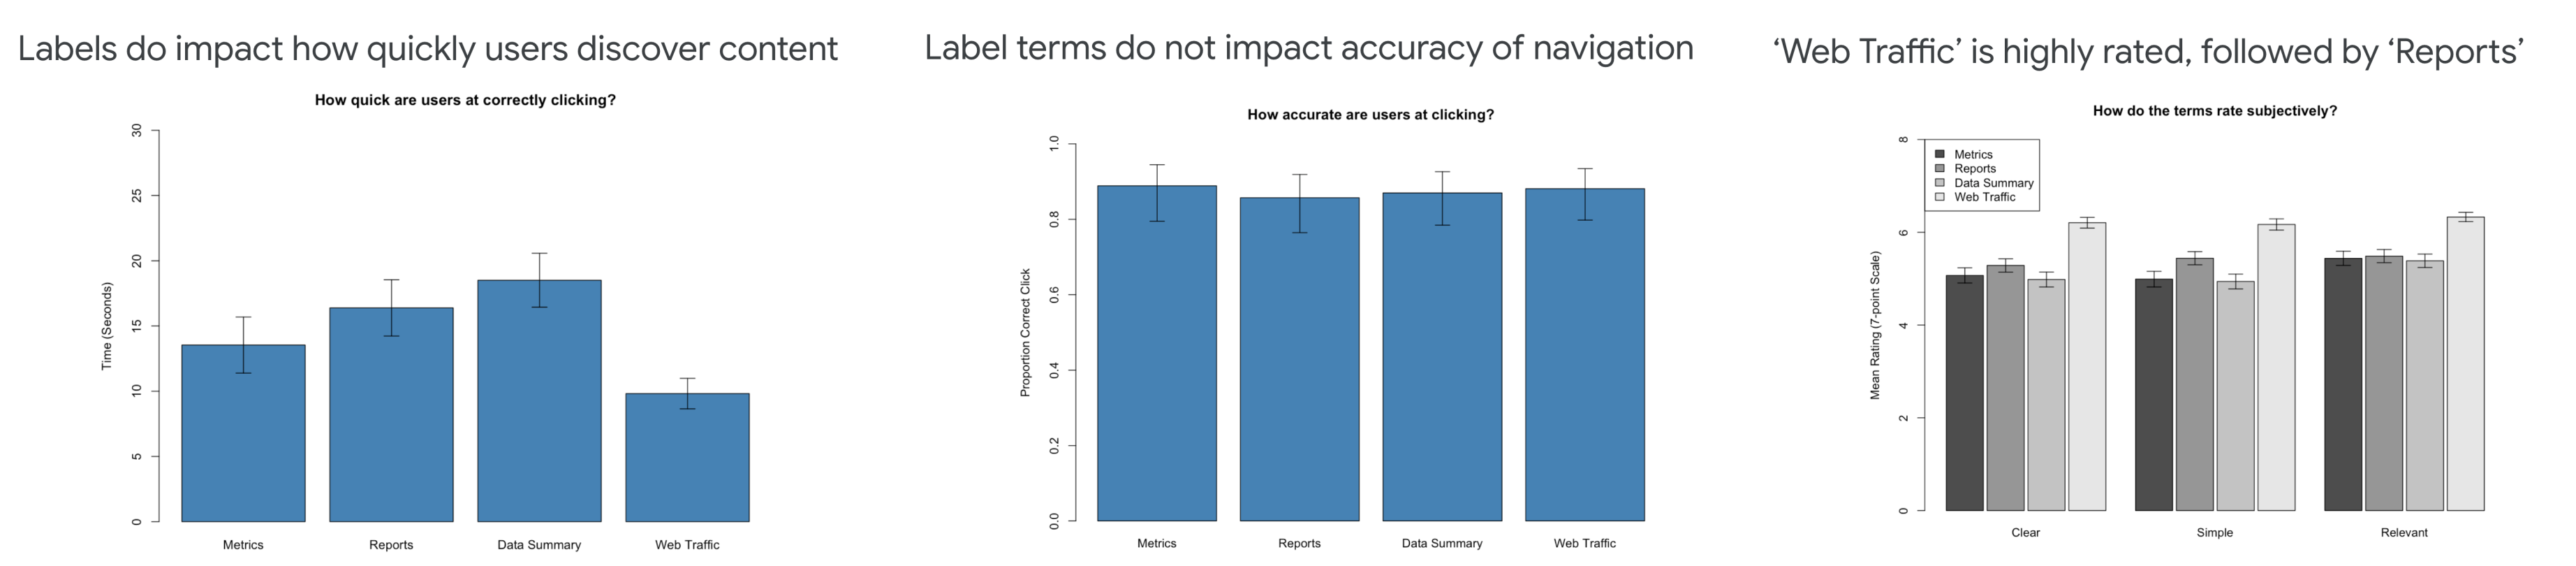
During the concept study, we used "Data Reports" to label the Search Console report within Google Domains. However, this term caused uncertainty among users regarding its connection to database queries. To address this, I collaborated with UXR, UX Writing, and PM to assess four alternative terms for the analytics section. We recruited a sample of 2,000 MTurk workers previously screened for domain experience, and a total of 398 surveys were completed (approximately 100 for each terminology variant). We then assessed the clarity, complexity, appropriateness, and discoverability of each label within our navigation menu.

The terms we tested were: Metrics · Reports · Data Summary · Web Traffic.

Terminology study results
Terminology studyTesting candidate names against real user comprehension at scale.

Key takeaways

All tested labels allowed users to correctly navigate to the analytics section. However, "Reports" was the most effective label, enabling quicker user navigation without sacrificing accuracy.

Recommendation: adopt "Reports" as the primary label for the analytics section.

While "Web Traffic" rated highly in clarity and relevance, "Reports" offers a balance of speed and accuracy, potentially accommodating future expansion beyond web-specific data.

Scoping the v1 feature set

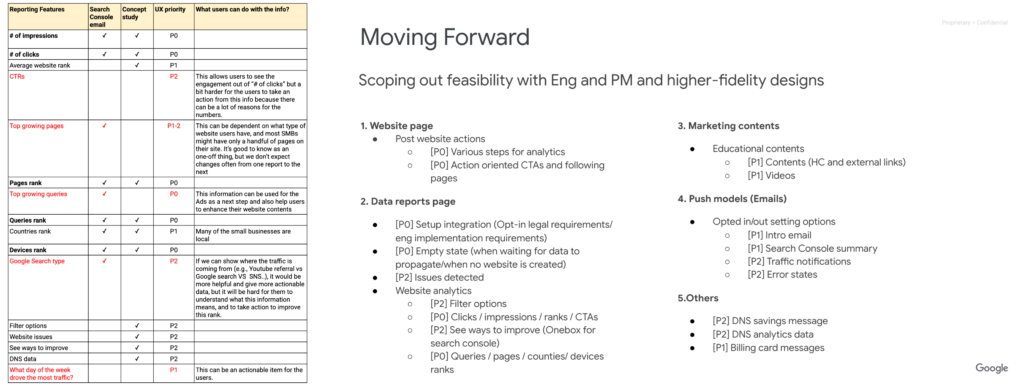
Based on the insights from the concept study, UX created lists of features critical to users, and I collaborated with PM and Eng to scope the top-priority feature for our v1 version.

Scoping the v1 feature set with PM and Engineering
Feature prioritizationMapping user-critical features against engineering feasibility to define the v1 scope.

Principles into a clear, useful report

I distilled the research into three design principles, then delivered a final design that makes traffic insight simple to set up, understand, and act on.

A. Design principles

Simplify set up and integration

Simplify the setup and adoption of analytics tools by integrating them directly into the Domains/website hub, minimizing additional effort for users.

Get to the right product

Introduce Reports at the appropriate stage of the web development lifecycle to maximize the efficiency of online presence improvement while providing bite-sized learning opportunities for users new to analytics tools.

Provide actionable and timely insights

Deliver clear, actionable insights and best-practice recommendations to help users quickly understand their website's performance, identify trends, and make improvements.

B. Design highlights

One-click integration
One-click integrationStreamlined setup process eliminates the need for DNS TXT verification, reducing friction and increasing accessibility for users.
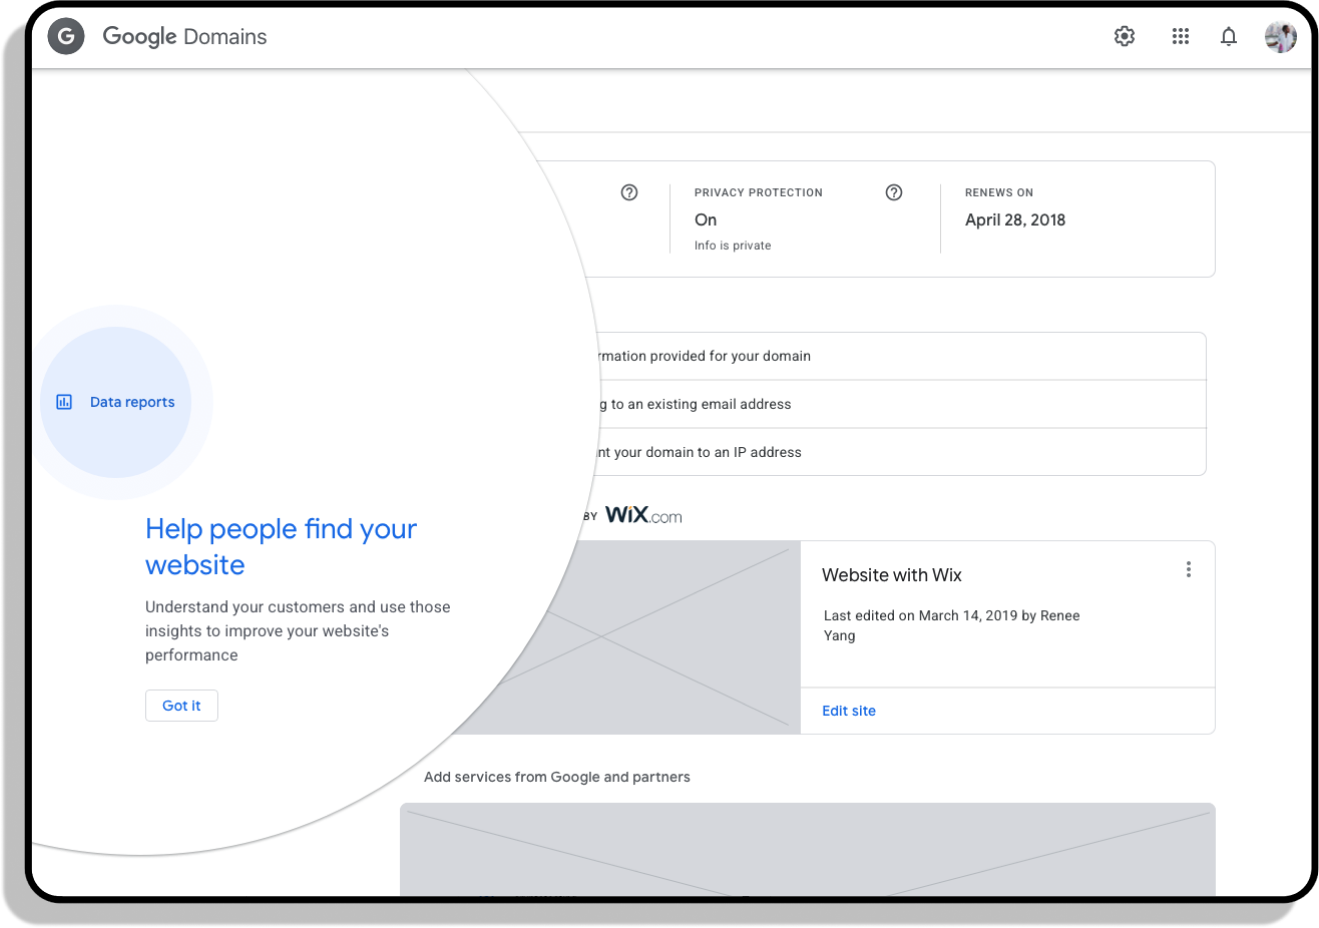
Educational elements
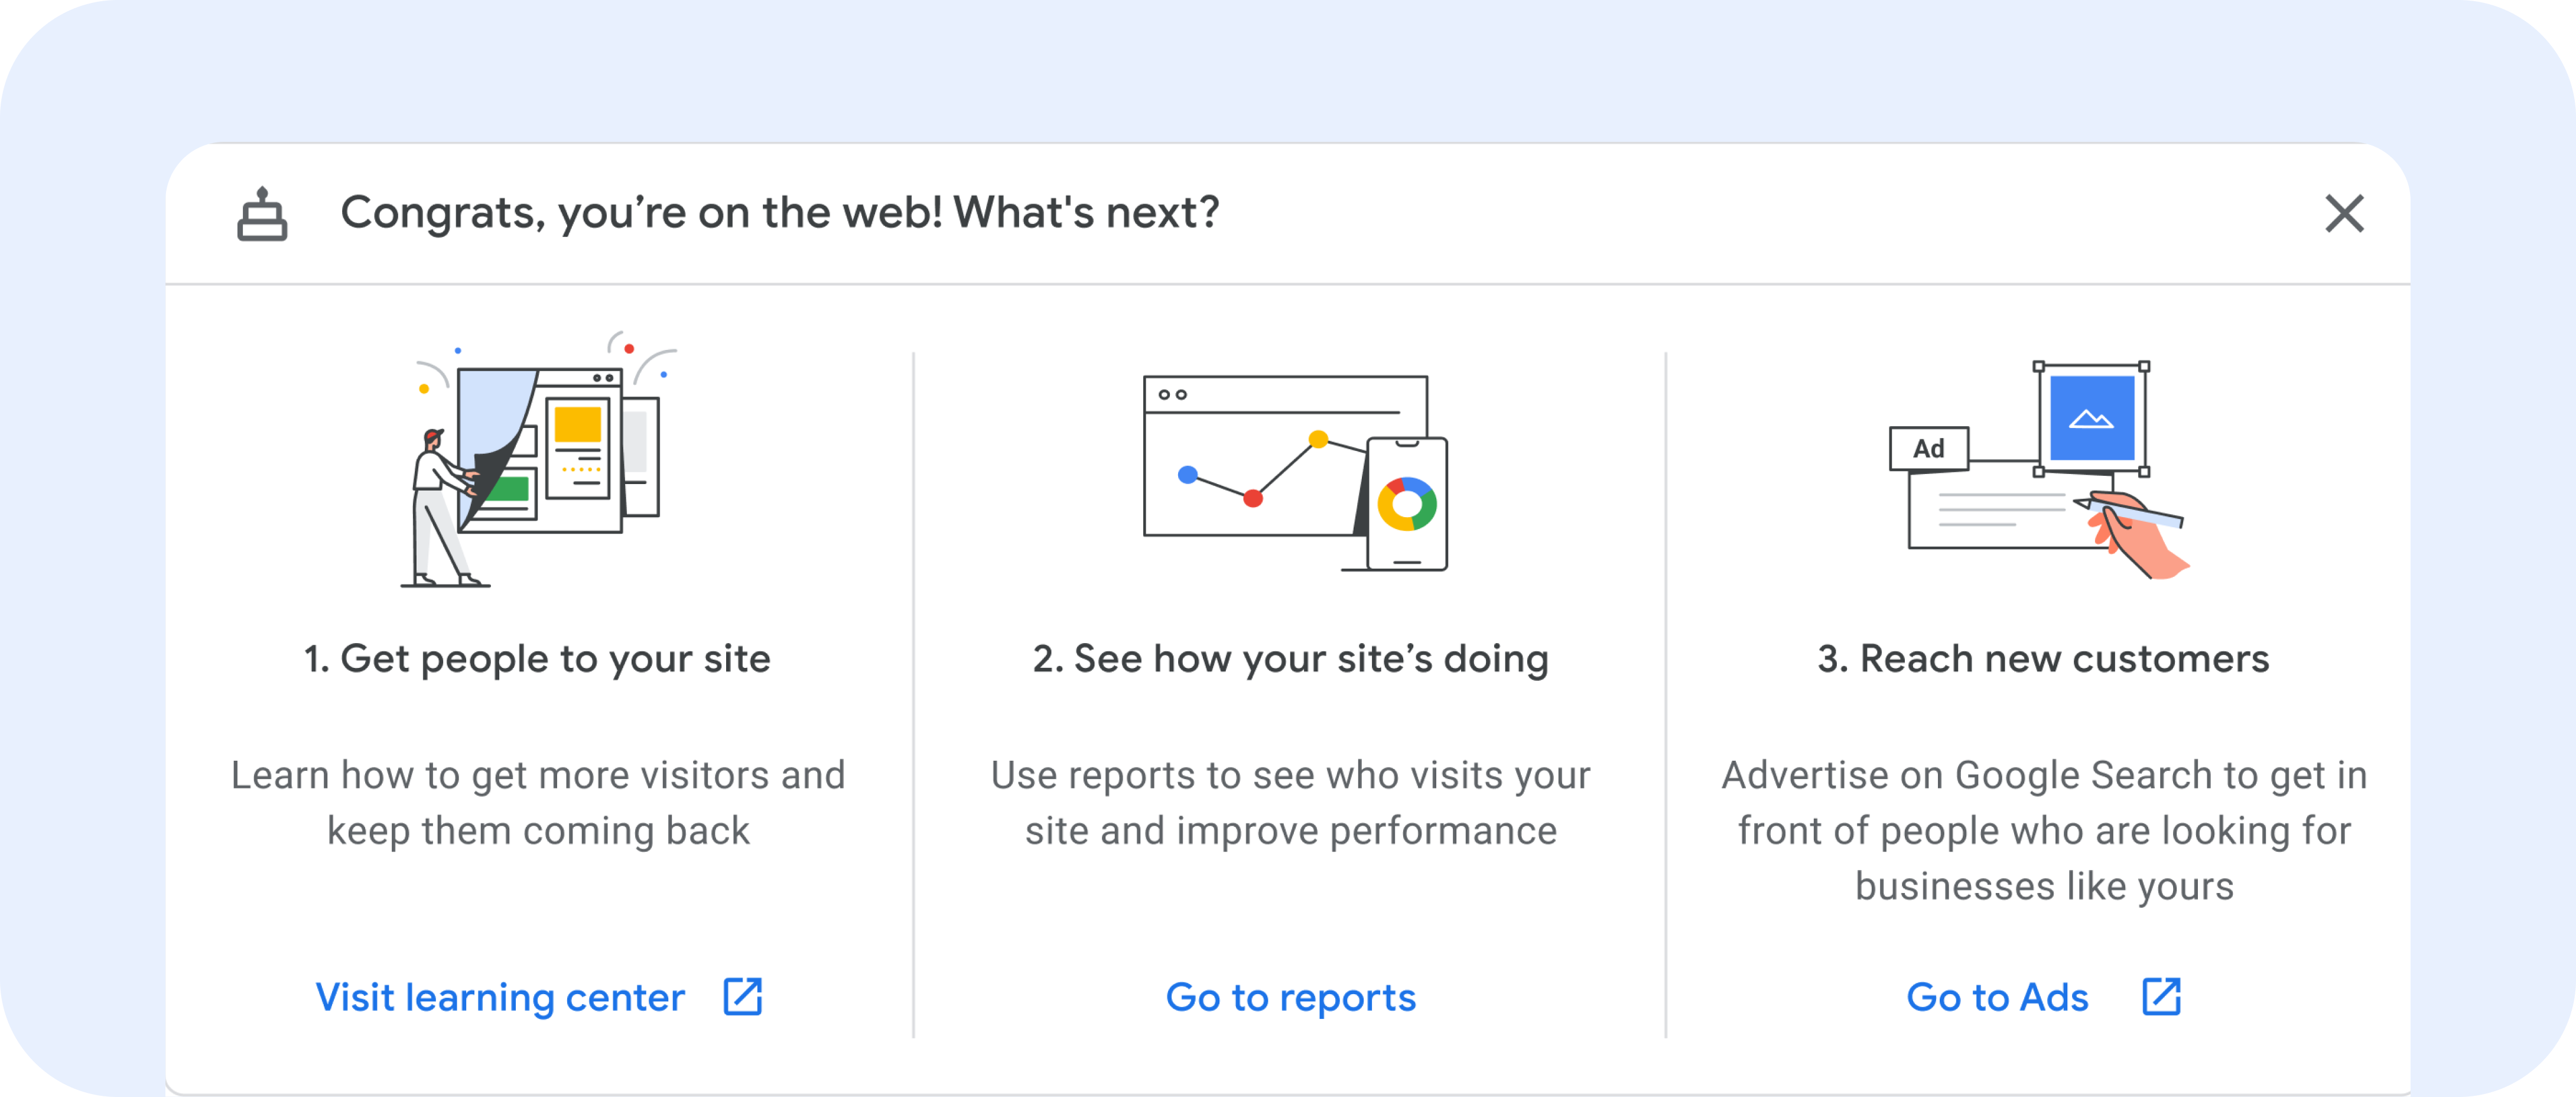
Educational elementsIntegrated educational components guide users through the reporting tool's features and benefits, providing contextual information to enhance comprehension and confidence.
Quick traffic summary
Quick traffic summaryHigh-level insights on recent website traffic are prioritized to give users an immediate understanding of their site's performance.
User-friendly UI & terminologyA clear, intuitive interface and accessible language cater to non-technical users, ensuring a smooth and understandable experience.

Final design

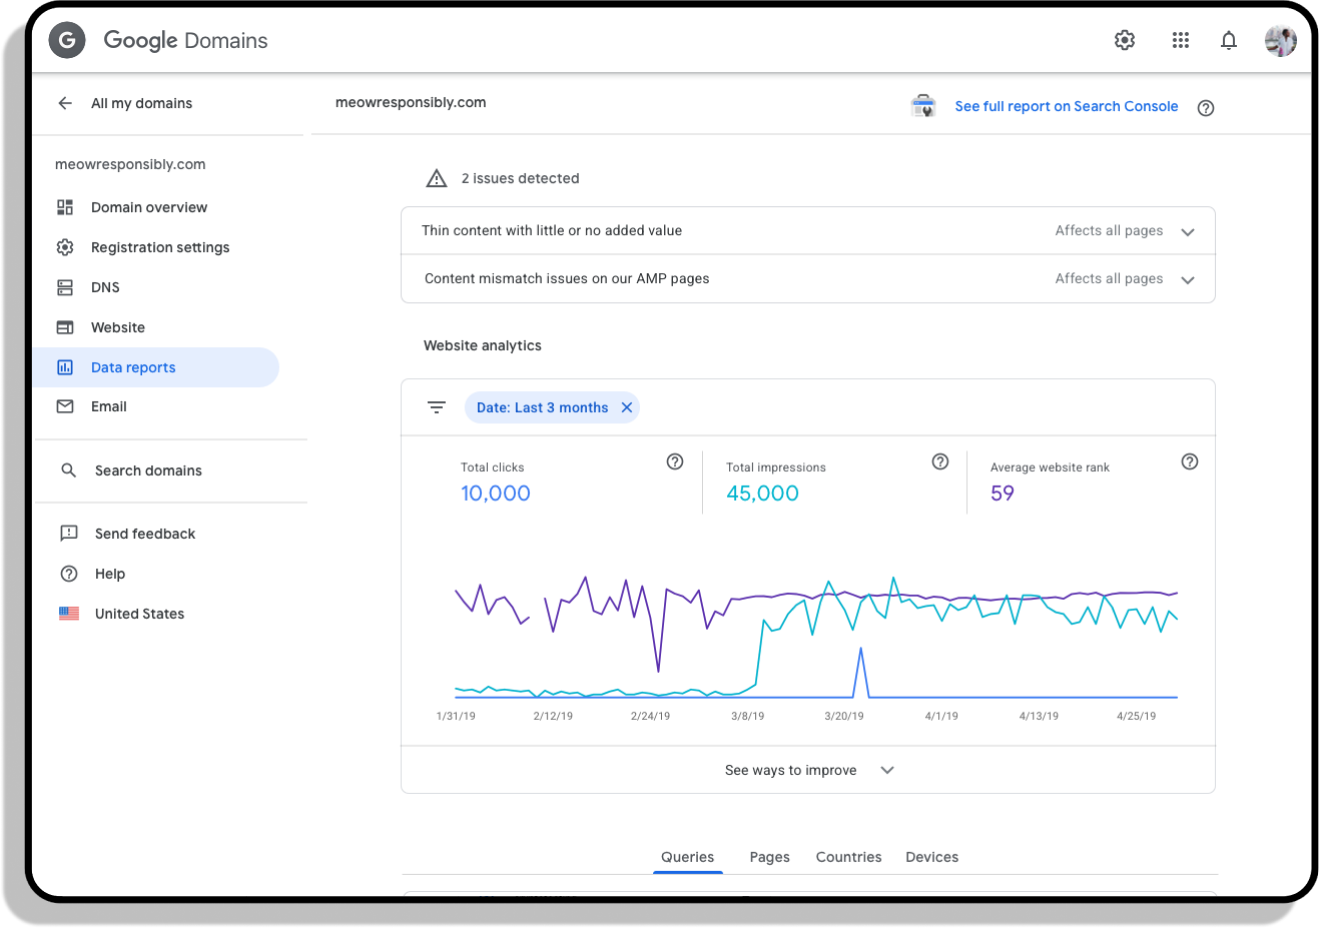
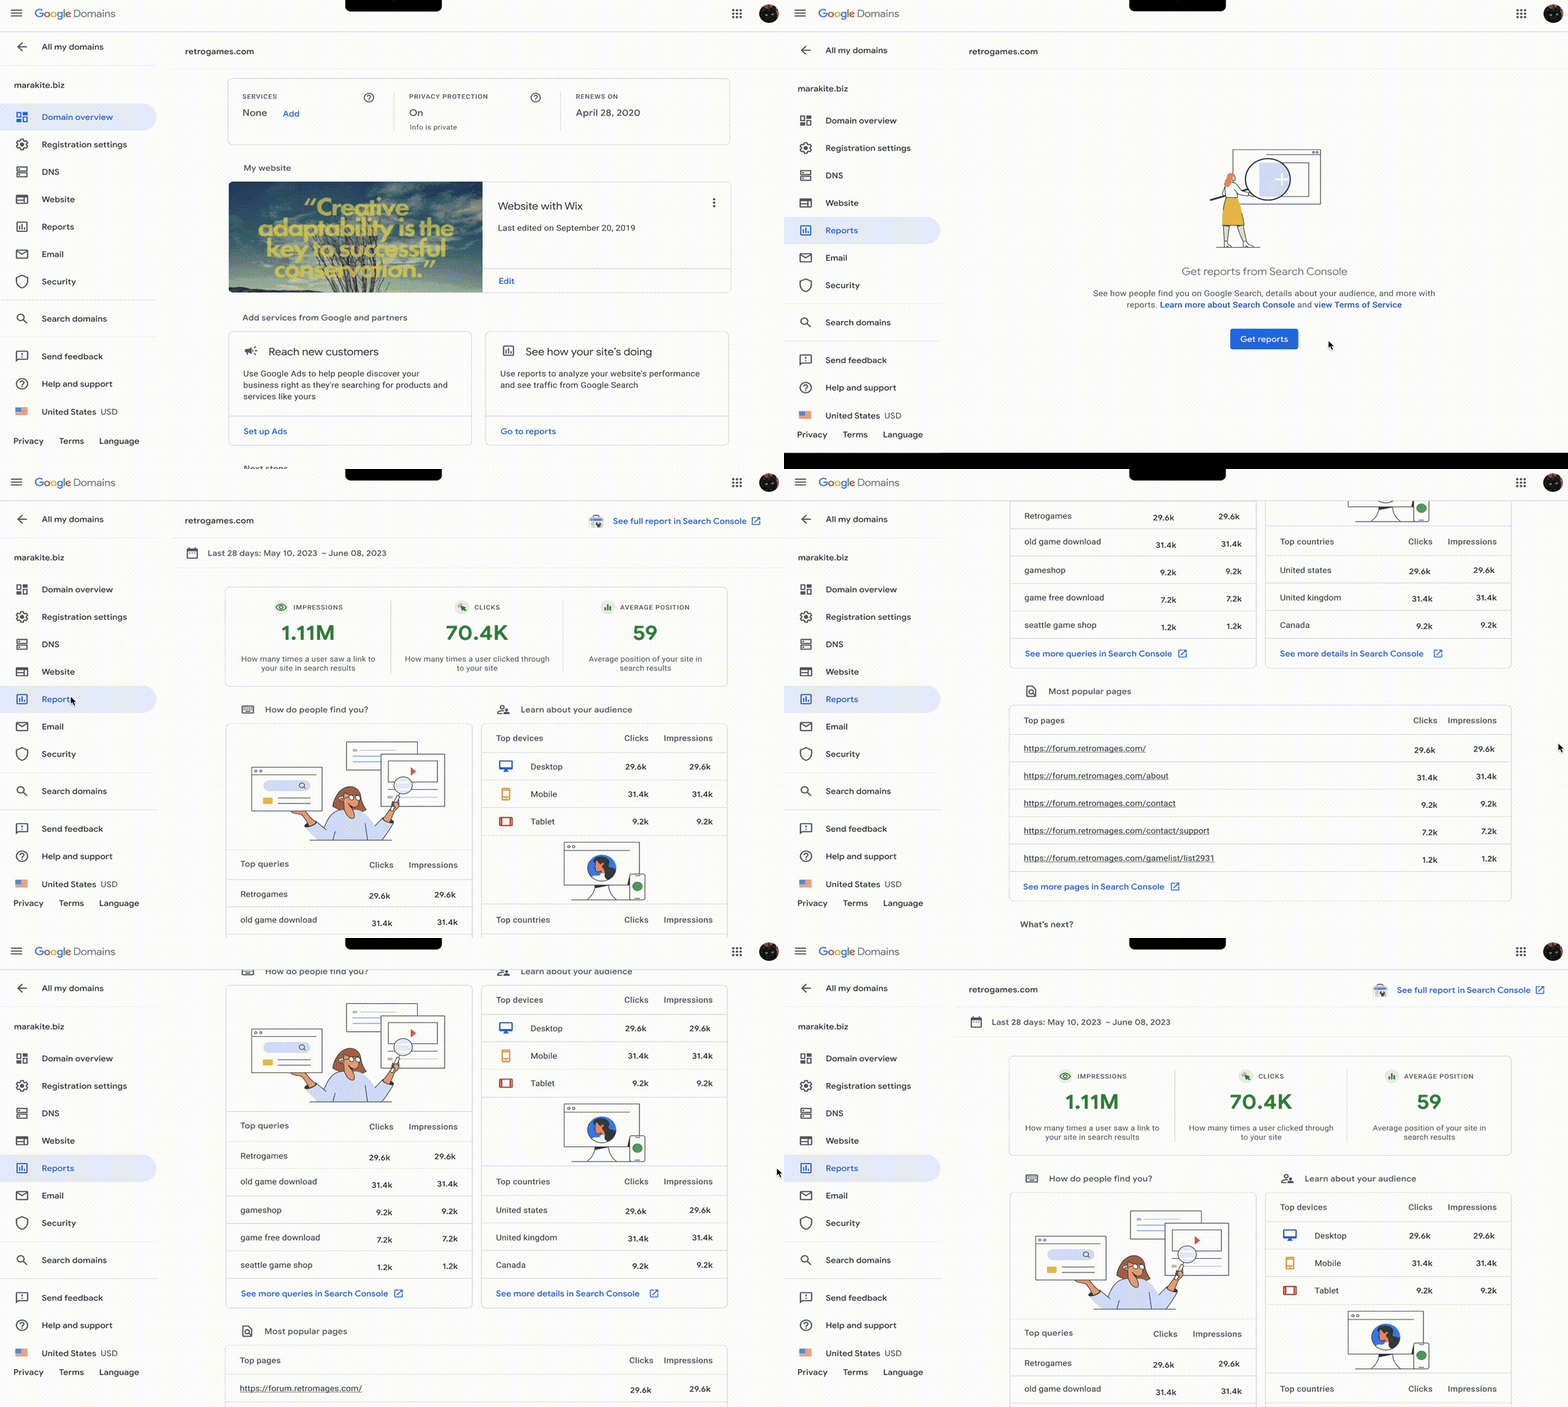
Reports final design walkthrough
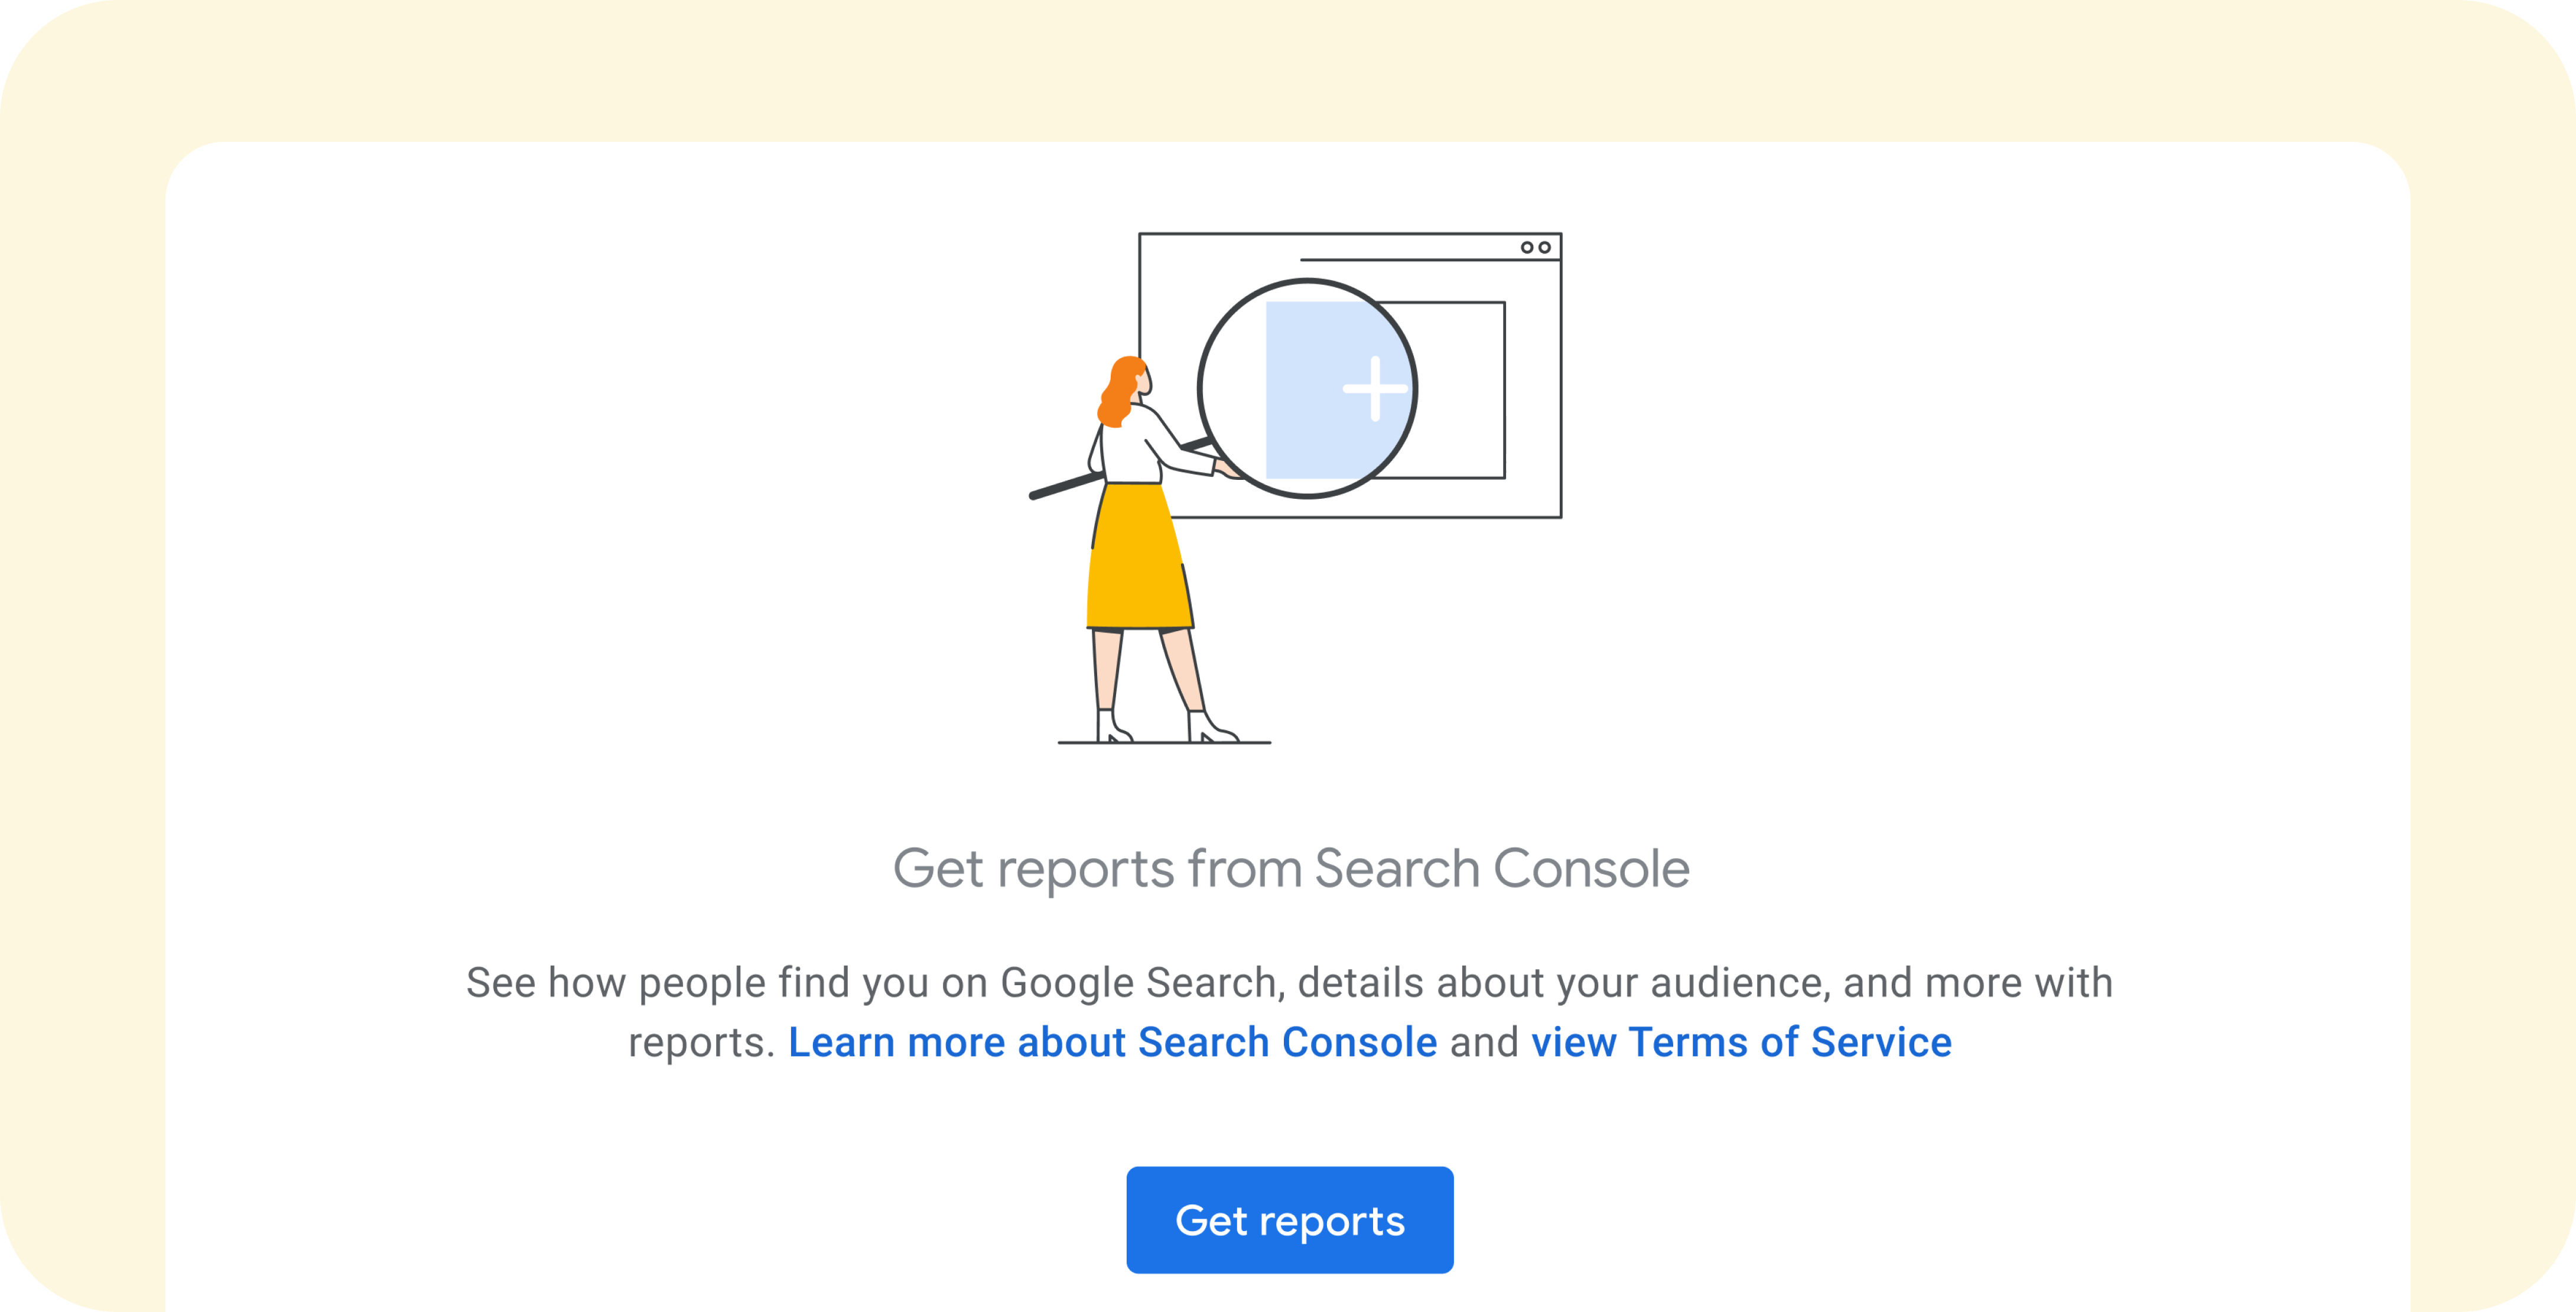
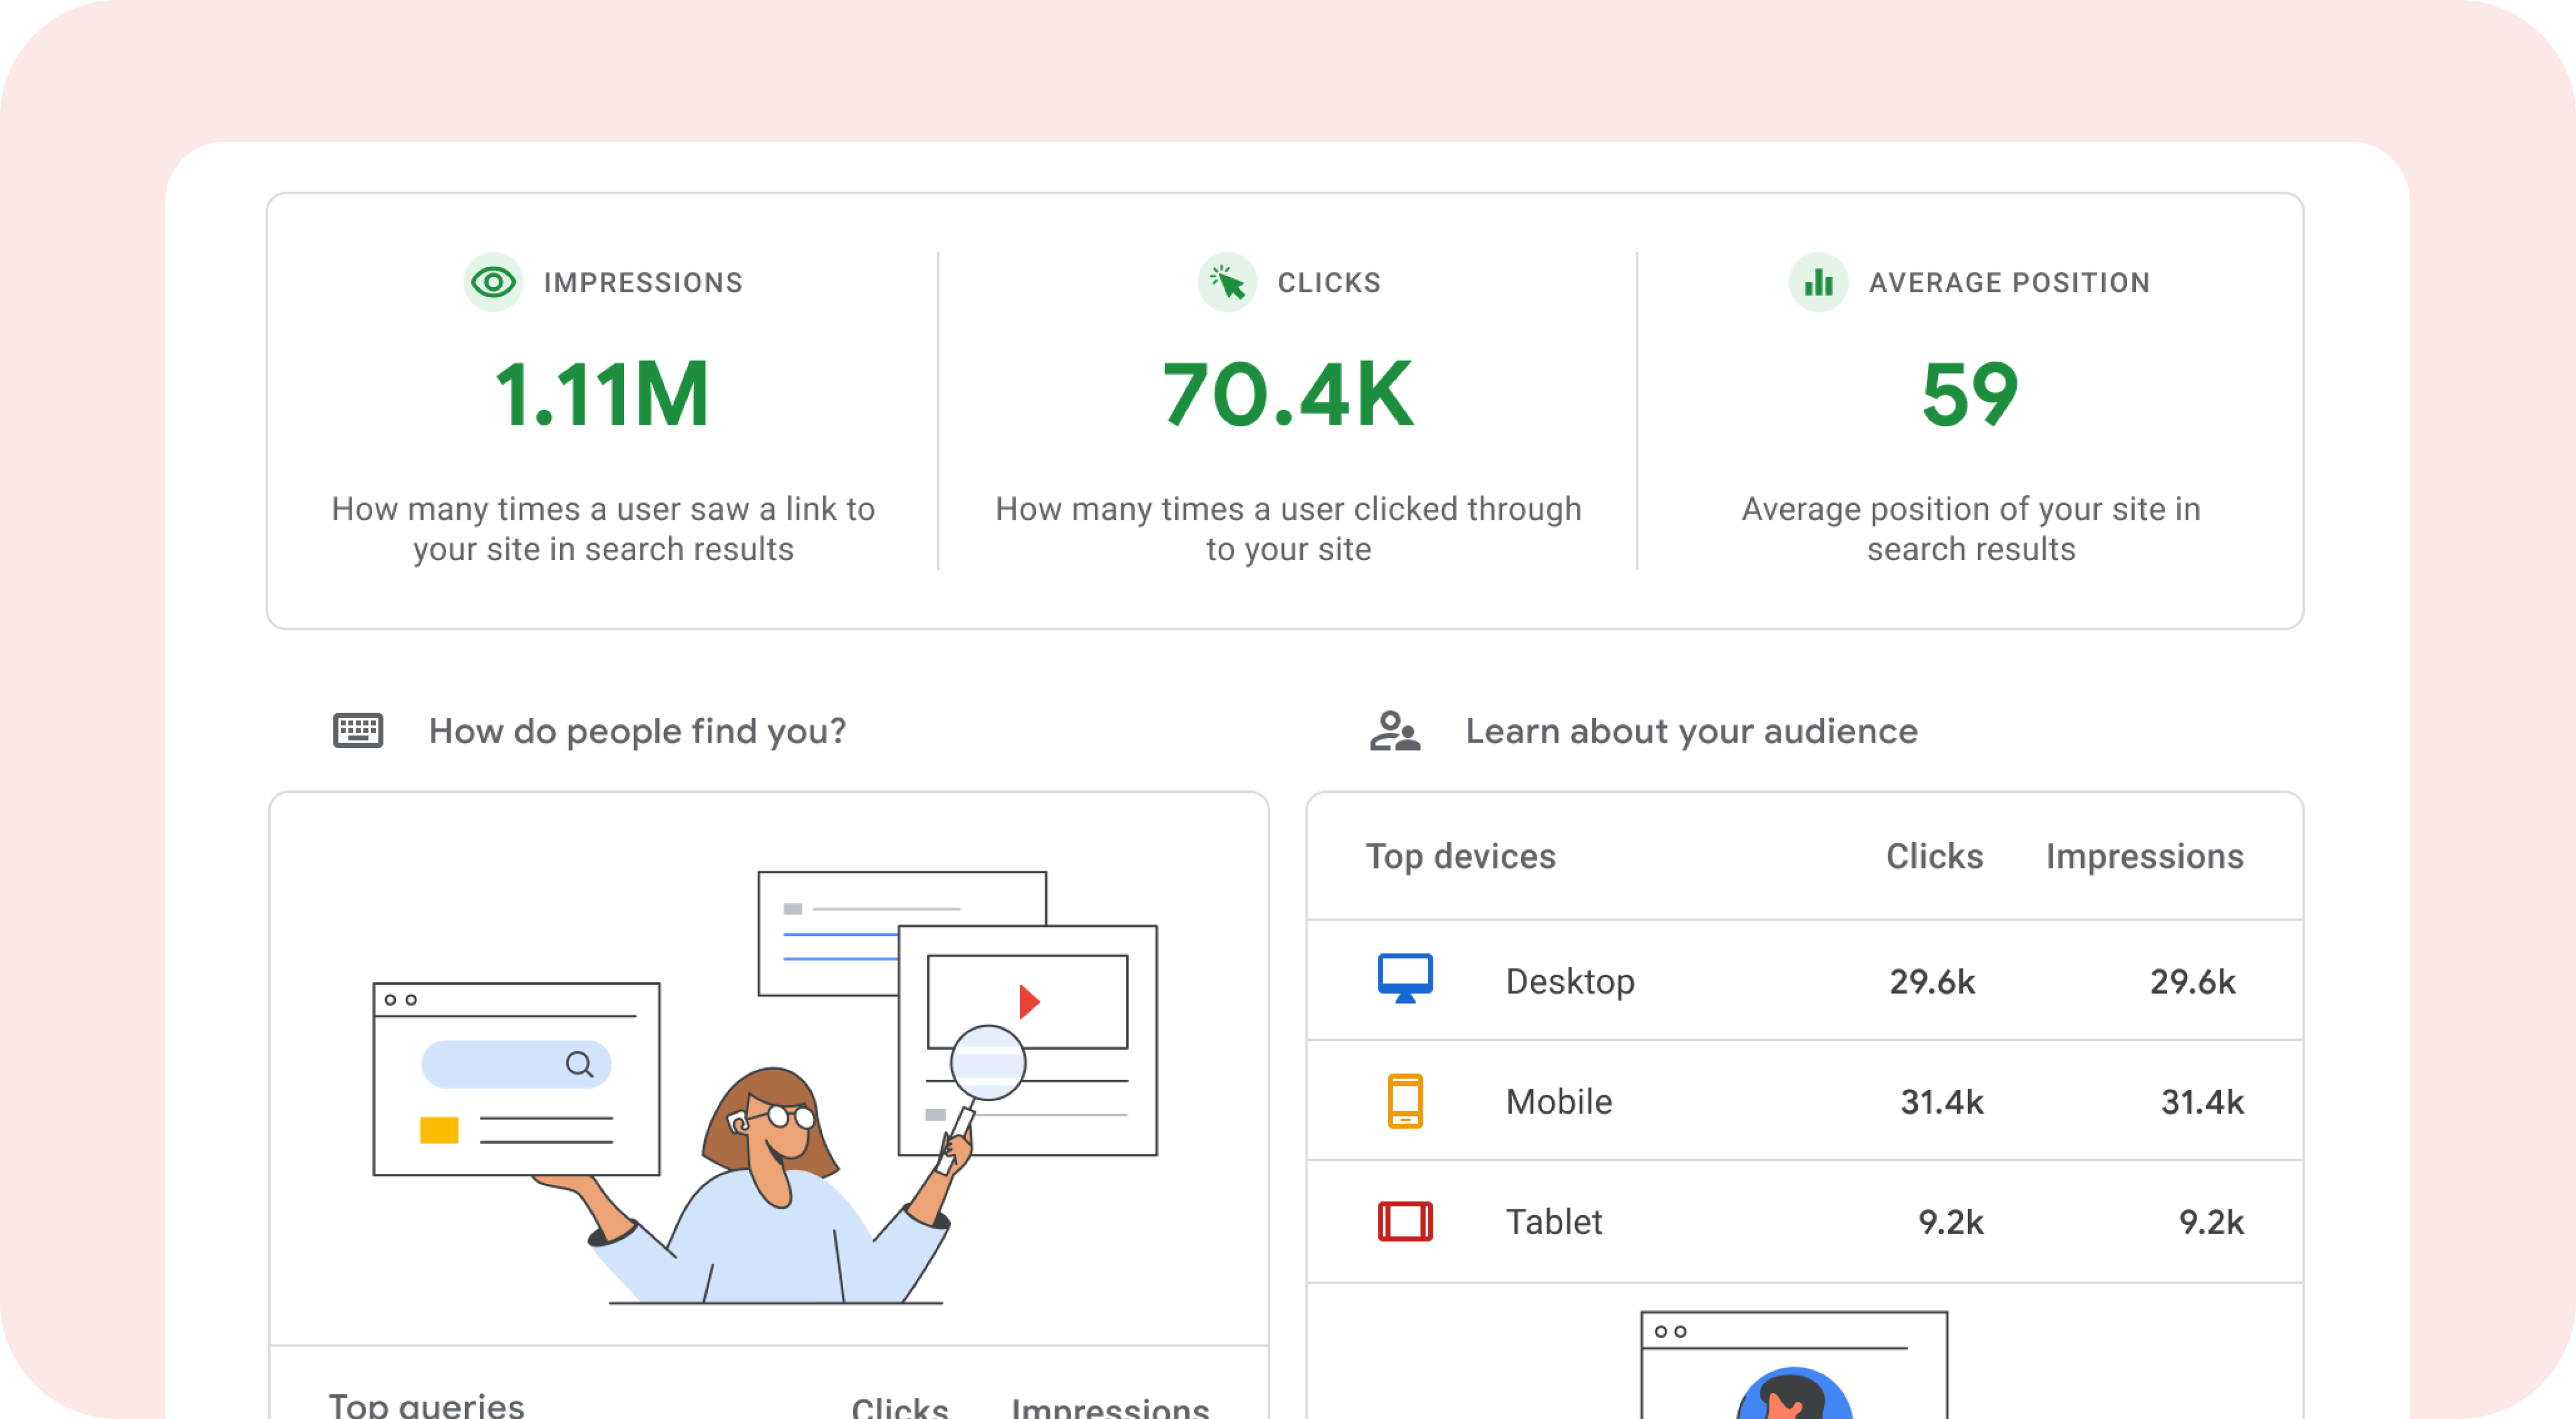
Reports in actionDomains Reports provide the ability to understand what drives traffic, optimize content, and see which pages are performing best.
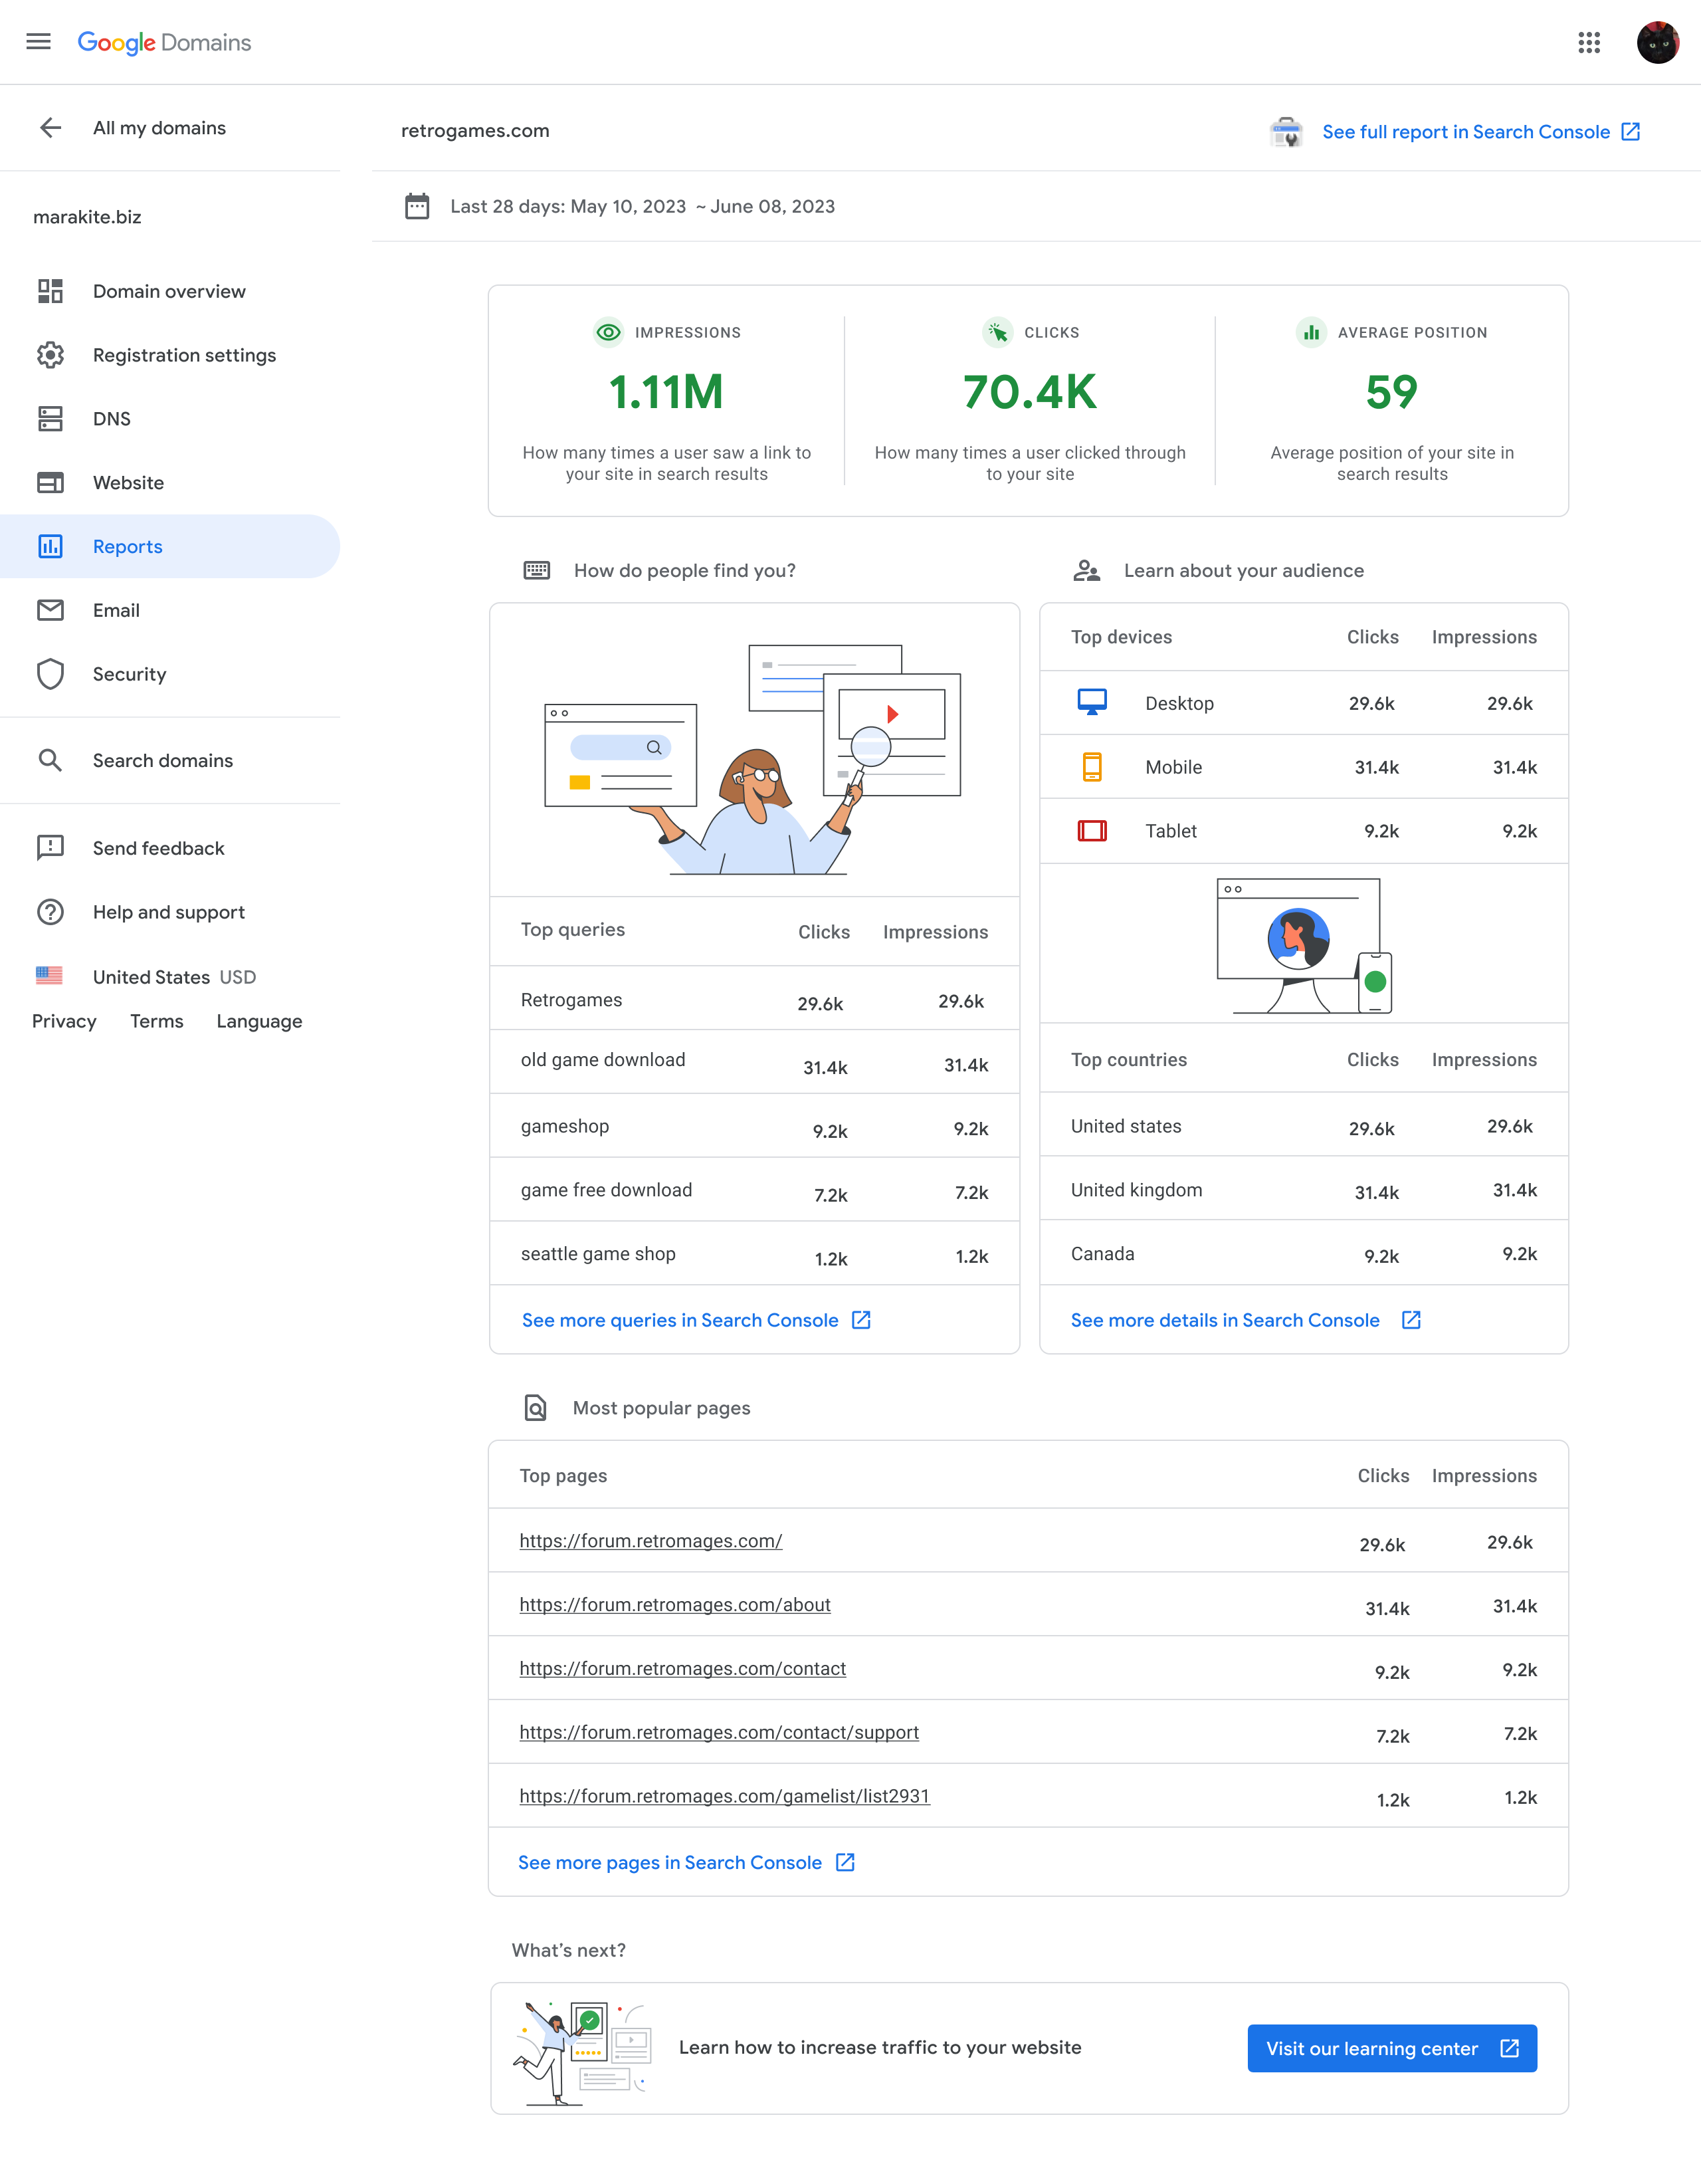
Reports final interface
Reports overviewThe final Reports interface within Google Domains.

Adopted across tens of thousands of domains

The launch of Reports in Q2 2020 yielded immediate results:

11,000+
User adoption: domains created and verified their site in Search Console within a month
22,000+
Engagement: report views, with users returning to the product multiple times to check data

This successful launch delivered on key goals

Listening after launch

In February 2021, as a follow-up to the Reports launch, I collaborated with UXR to conduct a user insight study to see how it had landed after 9 months. The research addressed the following high-level questions:

  • How are users engaging on the reports page?
  • What information do users find useful on reports?
  • Are there any pain points when using reports?

Methodologies

1

Heuristic evaluation

Walked through the existing user journey against usability principles to identify potential pain points.

2

Log analysis

Sampled 30k sessions of reports-page action logs to surface behavior patterns and drop-off points.

3

In-product survey

A HaTS survey on the reports page capturing reasons for setup, visit frequency, and positives/negatives.

Based on the insights, I created the deck for short-term and long-term recommendations, and we launched v1.5 with the short-term recommendations incorporated in Q4 2021.

Short-term

shipped in v1.5
  • 1
    Stronger headline for ReportsHighlight the value of reports when users first visit the page.
  • 2
    Link to setup on the Website pageAdd a call-out for reports setup after website creation to prevent drop-offs.
  • 3
    Add search-term position to QueriesInclude position details in the "How do people find you?" card for context.
  • 4
    Timing of the welcome emailAlign the Search Console welcome email with report availability.
  • 5
    Log setup in the Domain DashboardTrack reports setup at the domain/user level for better insights.

Long-term

roadmap
  • 1
    Reports for forwarded domainsInvestigate setting up reports for both original and forwarded domains.
  • 2
    Help users take actionConvert learning-center content into actionable steps for improving visits.
  • 3
    Allow data comparisonsEnable comparisons so users can identify changes in website traffic.